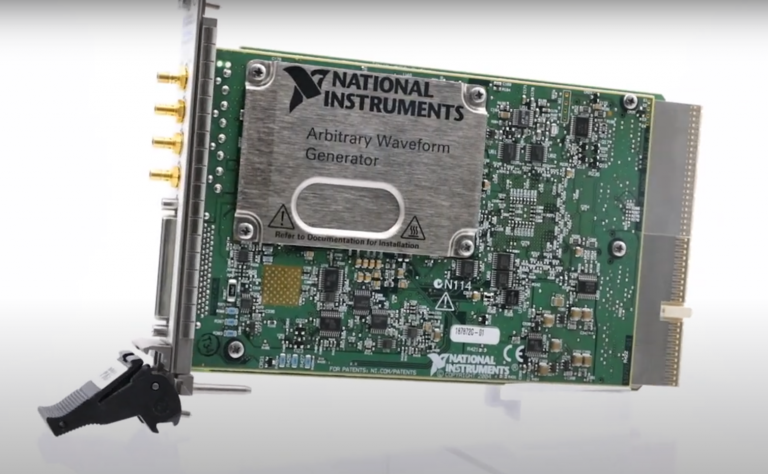
Setup and Optimize the National Instruments PXI-5441 Waveform Generator
The National Instruments PXI-5441 is a powerful PXI waveform generator designed to support high-speed waveform downloads up...
October 25, 2024
Waveforms play a vital role in ensuring the dependability, precision, and efficiency of test and measurement systems and devices. The waveforms displayed on the graph screen of an oscilloscope provide a convenient visualization for critical information about the signals under test, such as their properties, performance, and behavior. This post will serve as a quick and convenient guide to the importance of waveforms, some common shapes, and different types of measurements!
Waveforms are formed on an analog oscilloscope when an electron beam travels over the screen and is directly applied to the voltage that is being measured. The waveform is then traced onto the screen by the voltage’s proportionate upward and downward deflection of the beam.
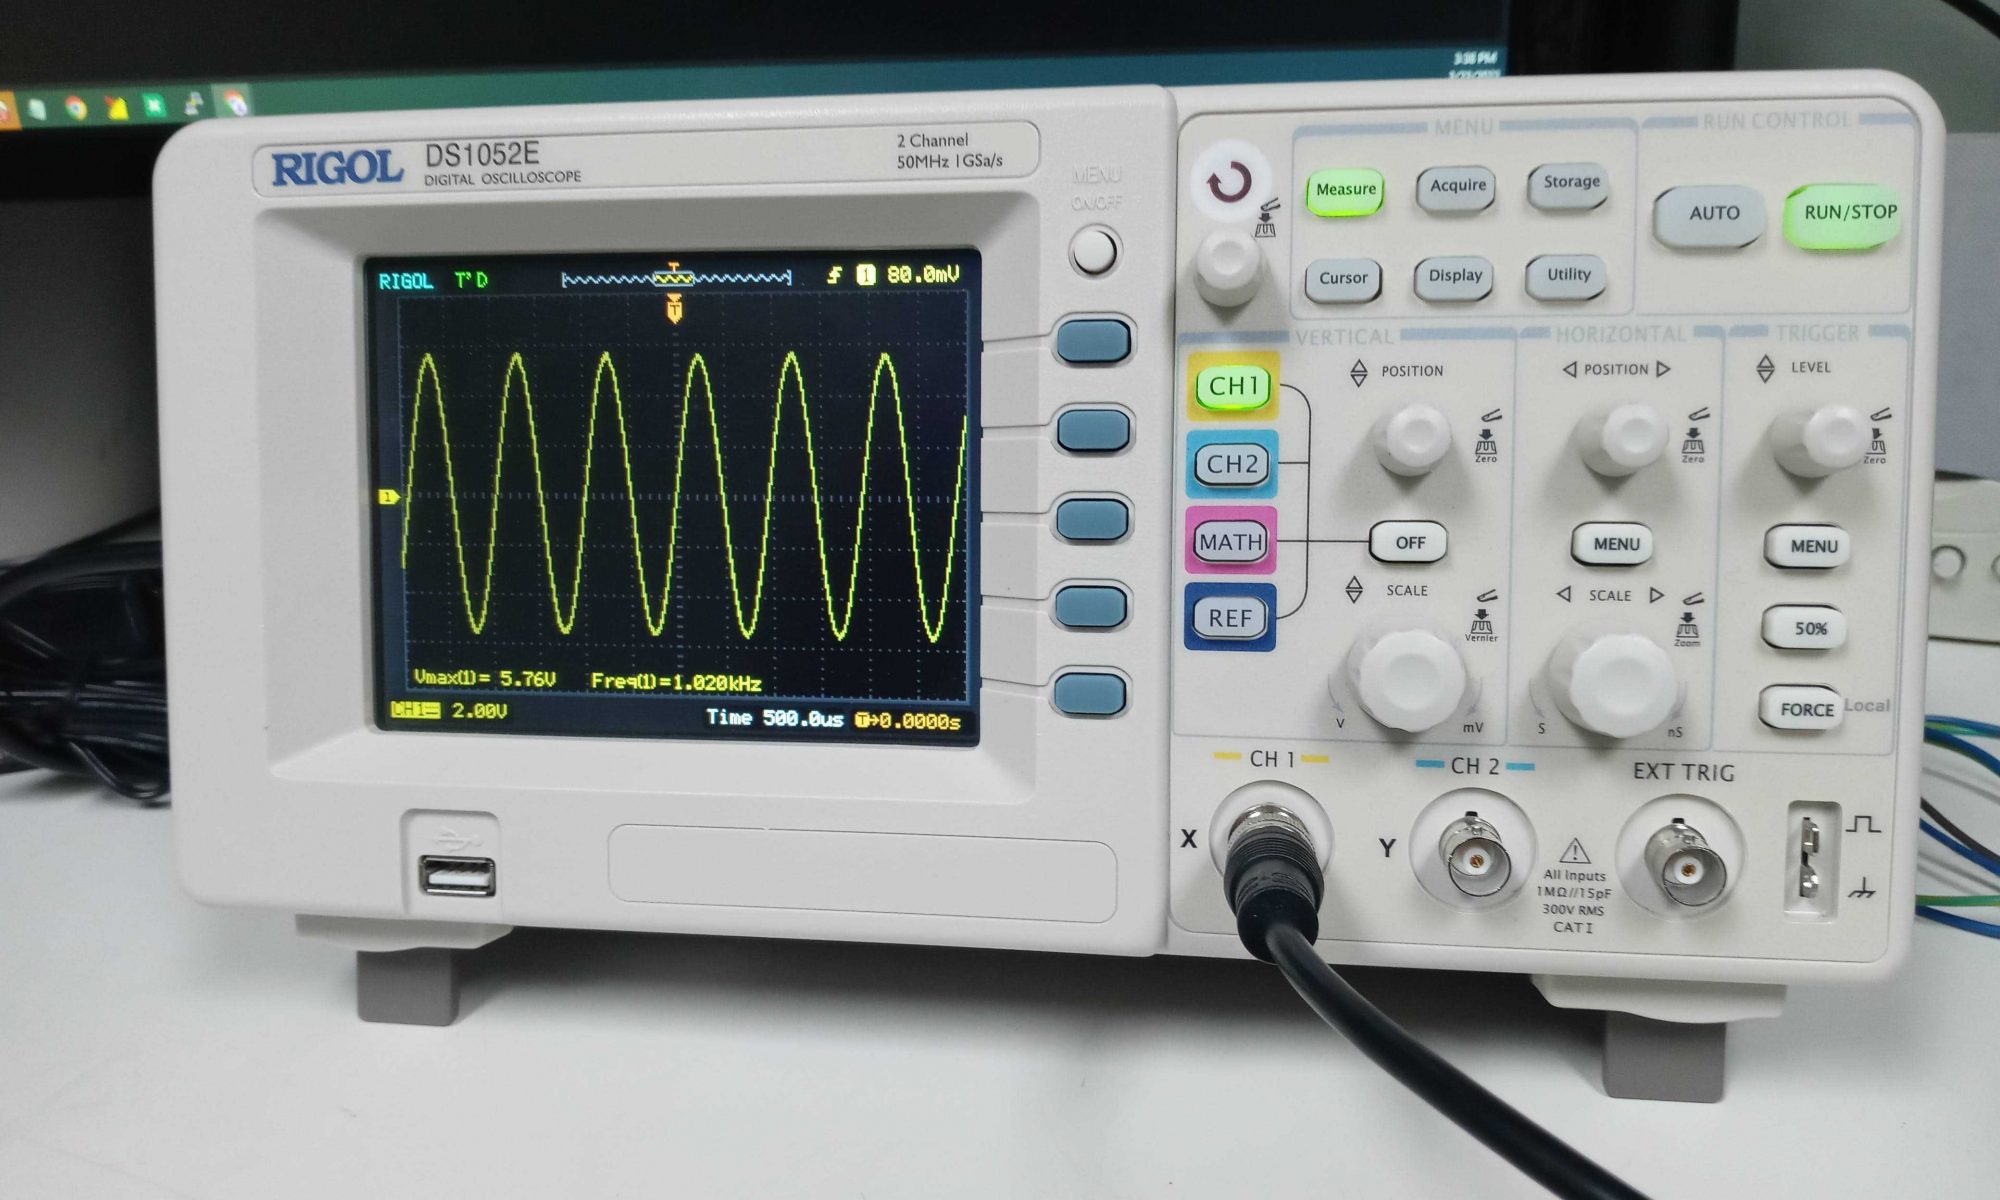
Sine Wave
The shape of the sine wave is one of the most recognizable waveforms. Mathematically, it is represented by the function y=sin(x). This means that the wave consistently oscillates above and below 0 as it moves forward on the X-axis of a graph.
A signal generator’s oscillator circuit frequently generates sine waves as test signals. Sine (or sinusoidal) waves are generated by the majority of alternating current (AC) power sources. Sine waves are also referred to as “fundamental waveforms”, due to their pure measurement- they do not have additional harmonic frequencies to deal with. When a sine wave eventually winds down instead of remaining consistent, that is known as a damped sine wave.
Note: Harmonics refers to when a waveform creates additional frequencies that are multiples of the source frequency (for example, a harmonic could be a wave that is measured at 2x, 3x, 4x, etc. the root frequency).
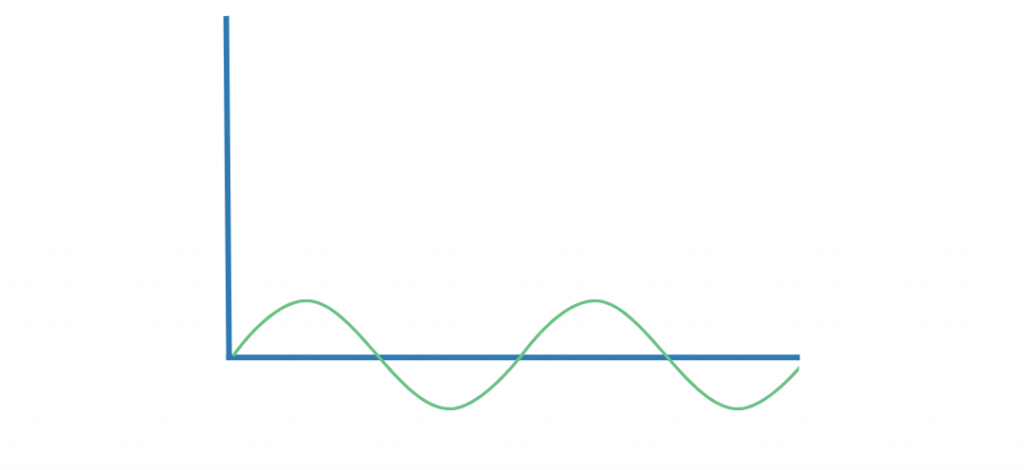
Square / Rectangle Wave
Square waves are another common wave type, commonly seen when testing amplifiers or measuring the timing of digital circuits. The shape of this wave is because it measures one of two binary outcomes: either +1 or -1. This makes sense when the device being measured regularly alternates between “high” and “low” or “off” and “on” settings. If using a good amplifier, the amplitude of a square wave can be increased with very little distortion.
Depending on the length of time between the high and low points on the graph, the wave is either referred to as a square wave or a rectangle wave. Square waves encounter only “odd” harmonics, so waves that are the 3rd or 5th or 7th (…) multiple of the frequency.
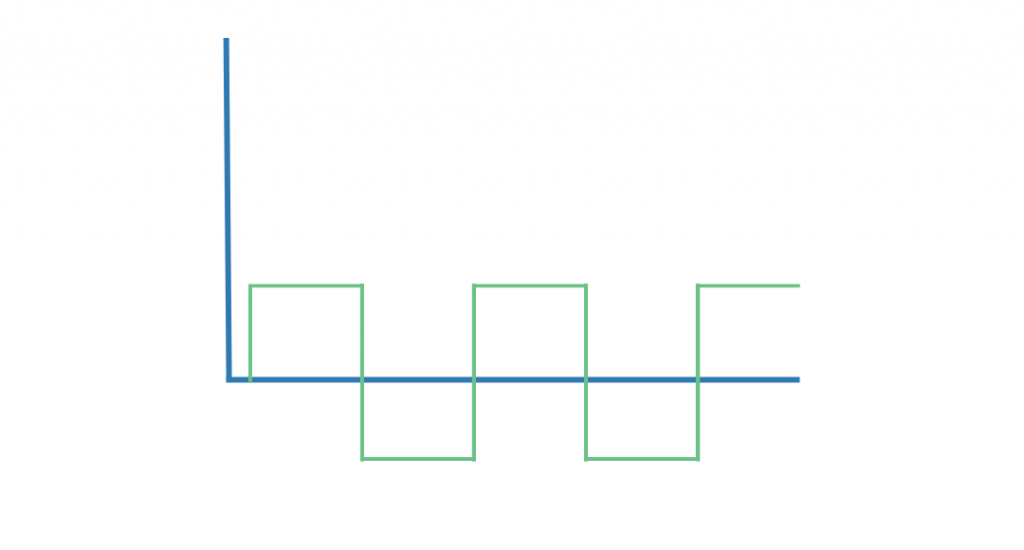
Triangle Wave
When circuits are made to linearly regulate voltages, it results in triangle waves. This shape occurs because the waves experience continual changes (ramps) in the levels of voltage that they transition between.
Like square waves, triangle waves only encounter odd harmonic frequencies.
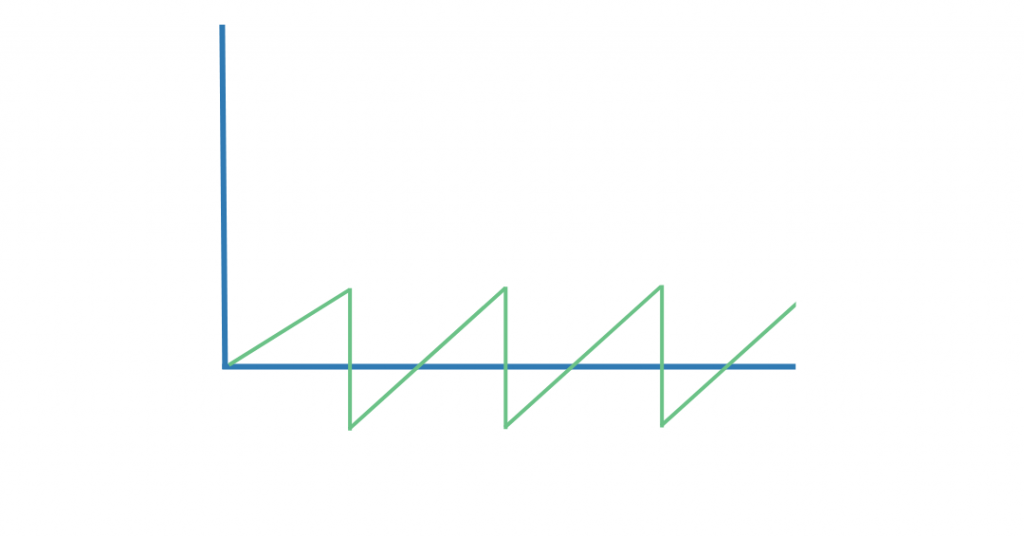
Sawtooth Wave
Much like a triangle wave, a sawtooth wave experiences continual changes in voltage levels. However, much like a square wave, it is characterized by a sharp drop following the ramp. One way that a sawtooth wave may appear is in the case of a capacitor that is charged with a continuous current source. If the capacitor shorts out and is suddenly discharged, it creates the sawtooth shape.
Sawtooth waveforms experience harmonic frequencies from every multiple frequency.
Frequency. If a signal is continually repeated, this is known as the frequency, A signal’s frequency refers to the number of times the signal repeats per second, and this is measured in Hertz (Hz).
Periods. The period of a signal is essentially the inverse of the frequency. The period refers to the length of time that it takes for a repeating signal to complete one cycle.
Voltage. Voltage refers to the difference in signal intensity between two places within a circuit. Peak-to-peak voltage is the term used to describe the voltage between a waveform’s maximum peak and minimum peak.
Amplitude. The difference in voltage measurements between two specific locations within a circuit is known as the amplitude. Most commonly, amplitude refers to the highest/greatest voltage measured from a starting voltage of 0. This starting point of 0 is also referred to as “ground”.
Phase. The phase of a wave indicates the present location of the wave in relation to a reference position. Phases are measured in degrees, with 360 degrees equaling one wavelength, The ideal example for this measurement is the sine wave, since a sine wave’s cycle has 360 degrees. This means that how the angle of the phase can be used to describe how much time of the sine wave has passed in degrees.
Electronics frequently encounter phase shifts, which are variations in time/position between two otherwise comparable signals.
Rise/Fall Time. The rise and fall time of a signal describes the transition of the signal from a low to a high level (or vice versa). These timeframes are very brief, but the measurement is especially important for modern digital systems that encode information.
While we have mainly been discussing the basics of waveforms and analog oscilloscopes, it is important to note that digital oscilloscopes have many features that make these measurements simple and effective. Oscilloscopes have many diverse applications- test them out today!
Additional Information:
A monthly email packed with valuable content—industry news, tutorials, obsolescence updates, and more. No sales pitches, just insights we think you'll find helpful!
The National Instruments PXI-5441 is a powerful PXI waveform generator designed to support high-speed waveform downloads up...

Companies in almost every industry are being transformed by artificial intelligence, and autonomous machines are...
The PXIe Platform from National Instruments offers an incredibly valuable toolset for test and measurement innovation. Its...

It is no secret that simulation and testing is an important part of designing circuits....